2.1. Notation and basic concepts
Here, we establish the notation and fundamental probabilistic structure that support the Bayesian formulation for finite-population inference used in this study. Thus, a finite population of known size N has its elements labelled by i = 1, 2…, N. We further assume these labels as known. It is further characterized by the set I = {Ii; i = 1, 2, …, N} of indicators such that Ii = 1 if unit i is included in a sample or Ii = 0 otherwise. The elements i of this population are the sampling units. In addition to the indicator Ii, each sampling unit is associated with a quantitative characteristic of interest yi (which may be a vector), forming the study population Y = {yi; i = 1, …, N}. Interest generally lies in parameters expressed as known functions T(Y), such as the population total, mean, median, or standard deviation.
However, these FPP can only be known exactly through a census. If, instead, we define a sample 𝐈𝑠𝑢𝑏={𝐼𝑖1,𝐼𝑖2,⋯,𝐼𝑖𝑛} being s = (i1, …, in) a subset of (1, …, N) of a size n = (dimension of s) ≤ N is drawn from I, the population will be subdivided into the sampled subgroup Ys = {yi; i ∈ s} and the non-sampled subgroup 𝐘𝑠𝑐={𝑦𝑖;𝑖∈𝑠𝑐}. That is, 𝐘={𝐘𝑠,𝐘𝑠𝑐}. The indicators I will be known for the entire population once s is available.
Since 𝑇(𝐘)=𝑇(𝐘𝑠,𝐘𝑠𝑐), it becomes clear that this parameter must now be estimated and relies on inferring 𝐘𝑠𝑐. Therefore, using only the known characteristics of the sample D = (s, Ys), inference methods must be applied to obtain information about the characteristics of 𝑌𝑠𝑐.
In frequentist survey sampling (Cochran 1977; Lumley 2010), inferences about T(Y) are based exclusively on the probability distribution of I, which is induced by the specific sampling design used to collect the sample, while Y is considered fixed. This approach is termed “design-based”. In contrast, the Bayesian approach (Gelman et al. 2015) is “model-based” and treats both I and Y as random variables with a joint distribution:
where θ and ϕ are parameters associated with Y and I, respectively. In BFPI, the central object is the posterior predictive distribution 𝑝(𝐘𝑠𝑐|𝐘𝑠,𝐈).
A solution of major practical relevance arises when the sampling design is irrelevant for inference (ignorability) and the units of Y are exchangeable. We will now formalize the conditions for these properties to hold and define the Polya posterior as a non-informative predictive distribution suitable for inference of T(Y) when these properties are valid.
We use π(·) as probability distributions of hyperparameters θ and ϕ, retaining the notation p(·) for Y or I. The complete likelihood is given by eq. 1 while the observed likelihood is
By Bayes’ theorem, the posterior distribution for the parameters is
However, since interest lies in θ, which parameterizes the distribution of Y, we integrate the above distribution with respect to ϕ:
We assume prior independence between θ and ϕ, i.e., π(θ, ϕ) = π(θ) · π(ϕ). We also assume p(I|Y, ϕ) = p(I|Ys, ϕ), meaning that there is independence between sampling units inclusion probabilities and the quantities of interest associated to, at least, the unobserved fraction of them 𝐘𝑠𝑐. This property is known as the ignorability assumption, which renders the sampling design irrelevant for inferring 𝐘𝑠𝑐 conditional on Ys.
To verify this, we rewrite the last expression, incorporating the assumptions of independence between θ and ϕ and the ignorability of the sampling design:
where the last integral reduces to a normalization constant p(I), and thus I is removed as a conditioning variable in the posterior distribution of θ.
Finally, under an ignorable sampling design, the marginal distribution of Y is
If the elements of Y are independent when conditioned to θ, they are said exchangeable. Thus, under exchangeability of Y, we can write
Substituting into the previous expression and noting that p(Ys|θ)π(θ) = π(θ|Ys)p(Ys), we obtain
it follows that this integral defines the predictive distribution of 𝐘𝑠𝑐 conditioned on the observed sample values Ys.
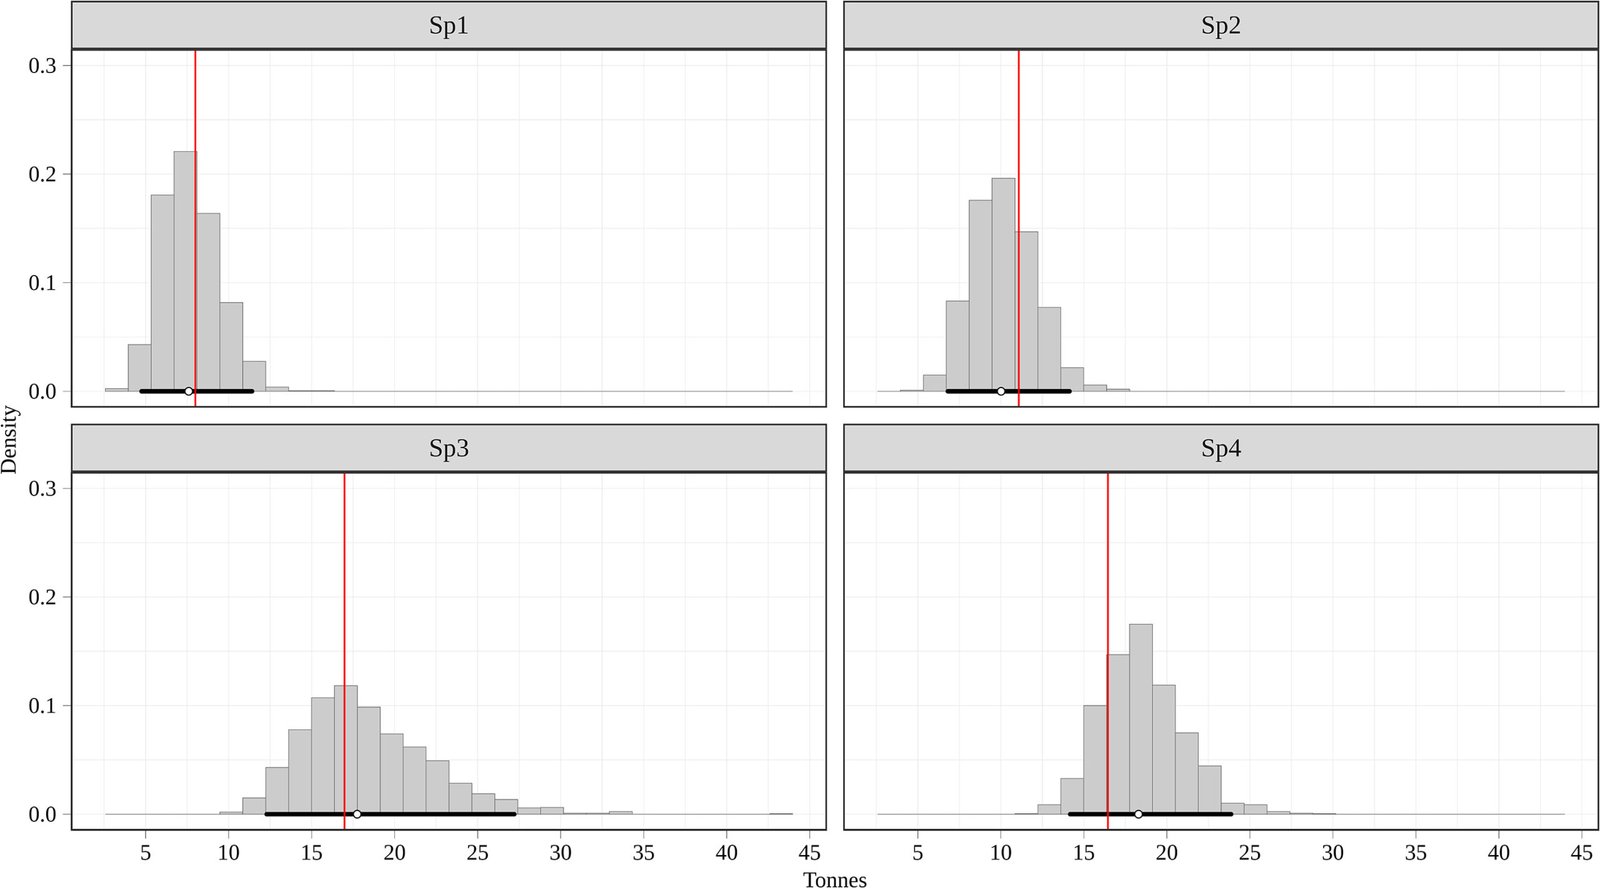
To simulate a sample from this predictive distribution, we proceed in two steps: first, simulate values of θ from the posterior distribution π(θ|Ys), and then simulate values for 𝐘𝑠𝑐 according to the model 𝑝(𝐘𝑠𝑐|𝜃). The T(Y) values associated with these simulations will determine the posterior distribution for this FPP.
An intuitive understanding of exchangeability is useful to assess whether this assumption is reasonable in practical situations. Let Y = {y1, y2, …, yN} with prior probability p(Y). Suppose it is discovered that the unit indices (labels) were misassigned and are actually a permutation I′ of the correct indices I; that is, we are actually referring to Y′ = {y3, y8, …, y2}. If p(Y) = p(Y′) for any Y′ with permuted indices relative to I, then the population Y is said exchangeable.
In the next section, we present a generic and useful method to obtain a predictive distribution, even in cases with insufficient information to formulate a detailed model for Y. Only the assumptions of approximate exchangeability in Y and ignorability about the sampling plan are required.
2.2. The Polya posterior
After observing
Ys, we want to obtain the posterior predictive distribution
𝑝(𝐘𝑠𝑐|𝐘𝑠). This conditional probability implies dependence between the sampled and unsampled units and is implicit in the assumption of exchangeability for
𝐘.
Ghosh and Meeden (1997) show that this distribution can be easily obtained using a Polya urn model and denote
𝑝(𝐘𝑠𝑐|𝐘𝑠) simply the
Polya posterior.
We refer to this distribution simply as
where
k are the number of categories, the sample size
n is defined by
𝑛=∑𝑘𝑗=1𝑛𝑘,
nj are the number of units in
Ys that fall in category
j, and
𝐘𝑠𝑐 has
N −
n elements. In fact, when dealing with continuous variables, we use the most extreme case in which each observed
Yi defines a distinct category. In this case,
k =
n and (
n1,…,
nk) = (1,…, 1) =
1n. For more details see
Appendix A.
The Polya urn model is a powerful non-informative Bayesian approach when very little prior information about the population is available. It is non-parametric in the sense that no specific model
𝑝(𝐘) has to be specified once ignorability and exchangeability are acceptable assumptions. If an equal inclusion probability for all units can be ensured, these conditions hold, and the Polya posterior is always valid. However, in general, this condition is sufficient but not necessary. When at least some partial prior information about auxiliary variables is available, the Polya posterior can still yield very satisfactory results without equal inclusion probability, particularly in situations for which standard frequentist procedure are difficult to apply (
Lazar et al. 2008).
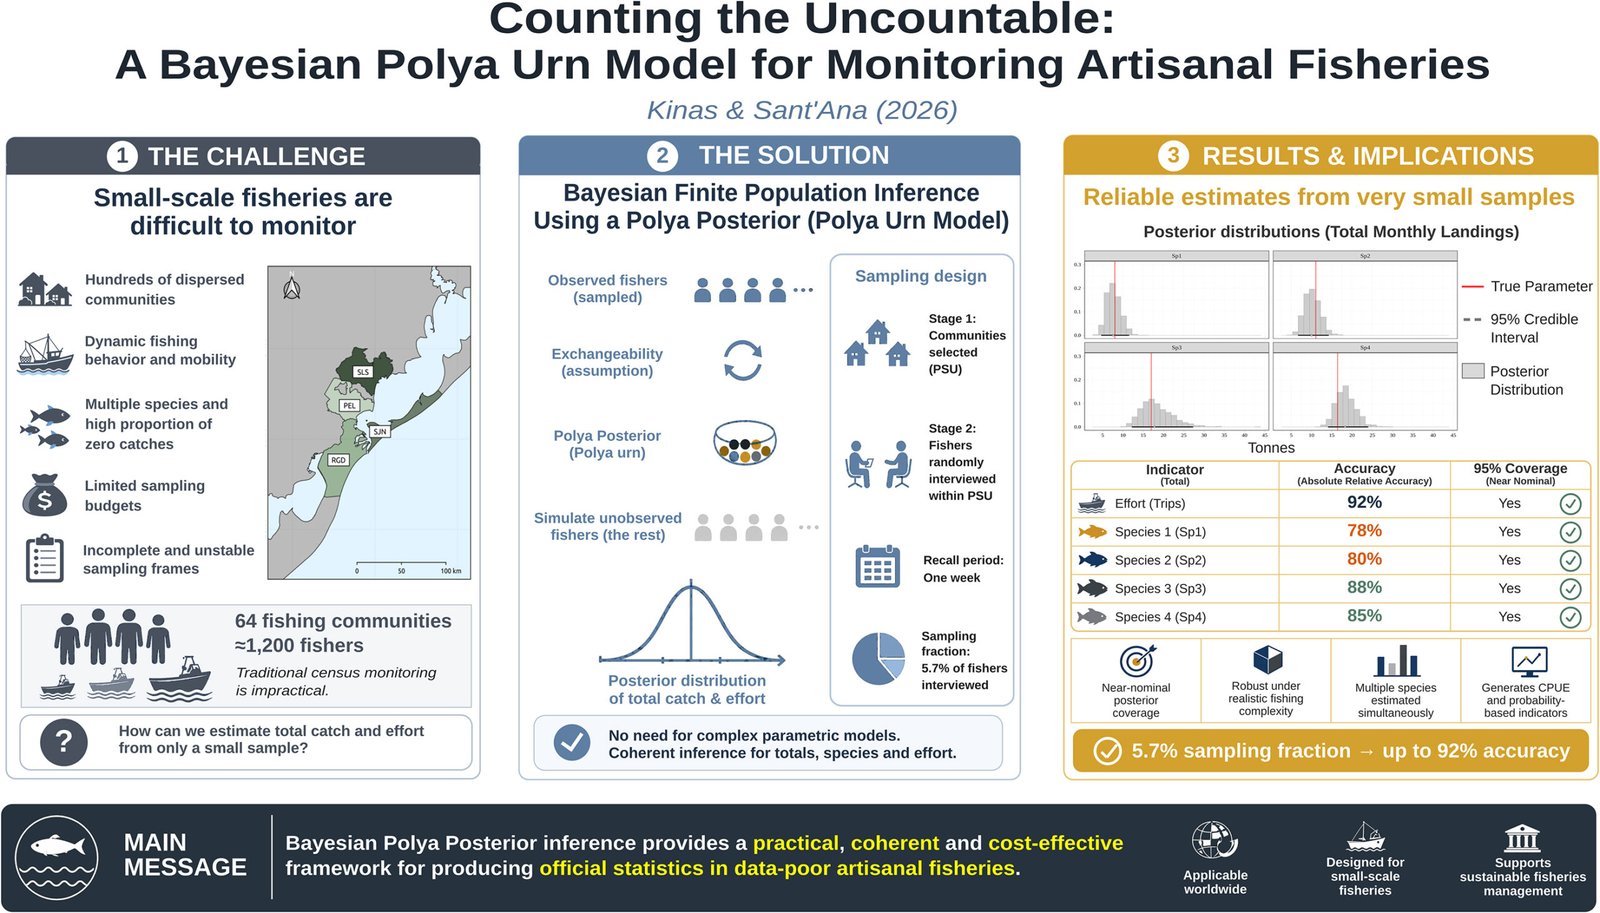
Within the scope of the PLE fisheries, which will be described in more detail in the next section, there were two pre-conditions that would invalidate overall approximate exchangeability. First, the distinct characteristics of the four municipalities. Second, variations in expected landings throughout the 4 weeks where changes in weather conditions, among others, can affect the outcomes. The inclusion of municipality and week as auxiliary variables made it possible to conceptualize approximate exchangeability as reasonable within each of these 16 resulting strata. Here, without loss of generality, we are modelling only the four weekly strata within one municipality, to estimate monthly total landings.
Even after guaranteeing at the outset the same inclusion probability of all fishers over a month period (
Section 2.4 for details), the sampling plan split these fishers between weeks, so that any selected fisher would report landings only for one specific (randomly selected) week. This was thought useful for two reasons: first, to obtain better quality data, as it is easier for fishers to remember the activity for 1 week rather than over the whole month; and second, to be less invasive to individual monthly production. Hence, for each sampled fisher, the three missing weeks are not exchangeable with the sampled week.
Across fishers within weeks (as strata), we have overall equal inclusion probabilities for the first week. When working with the sample for the second week, fishers that were previously sampled will have zero inclusion probability. In each subsequent week within a month, the number of fishers with zero-inclusion probability grows. However, we consider it still reasonable to assume approximate exchangeability within a week and build the Polya posterior accordingly. Any frequentist method relaying on expansions based on inclusion probabilities would face difficulties.
We used the
polyapost package (
Meeden et al. 2024) in R 4.4.2 (
R Core Team 2025) to perform the Polya urn simulations. Replicating this procedure
M = 1500 times, a simulated Polya distribution will emerge. Finally, for any FPP defined as a known function
T(
Y) to each of these simulations of
𝐘𝑠𝑐, the Polya posterior distribution for
T is obtained. Following advise by
Gelman et al. (2021) we included “mad.sd” (rescaled median absolute deviation; formula “1.48
*Median(abs(x − median(x))”; implemented in R as function “mad(x)”) as a computational robust estimate to be preferred over “sd”. To measure relative precision we further defined “mad.cv” as the ratio “mad.sd” divided by “median”.
2.3. A synthetic population
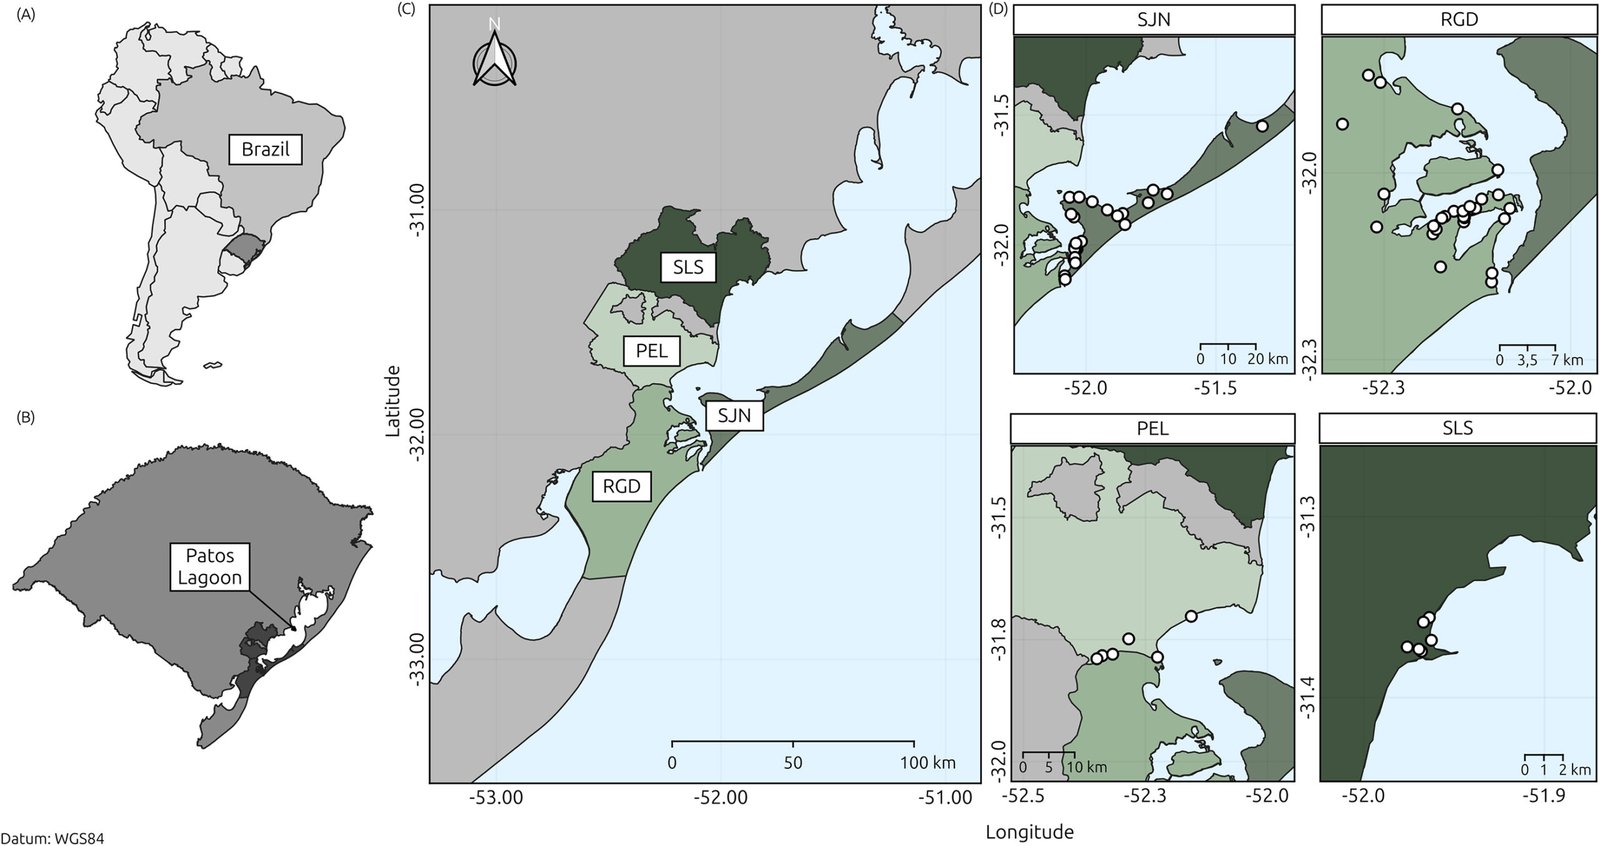
The characteristics that shaped the synthetic population to be used throughout were motivated by the actual artisanal fishery in four municipalities involving the PLE as shown in
Fig. 1. The Patos Lagoon is 265 km long with an average width of 40 km. The estuary comprises about 10% of the Patos Lagoon’s total area of 10 227 km
2 (
Möller et al. 1996).
The 64 communities shown as white circles on the map, are the home of about 1200 fisher and their families. Communities are of different sizes; from the smallest with about 10 fisher to the largest exceeding 100. For sampling purposes, large comnunities were previosly split into sub-groups of at most 55 fisher before sampling. Average distances among communities vary among these municipalities; smallest average 1.3 km, followed by 9.7 km, 10.8 km, and largest 21.9 m. The maximum distance between two communities within the municipality at the right border of the ELP is 97.1 km.
Each municipalities became a stratum, and, as such, it suffices to concentrate here on a synthetic population that features one typical municipality, only. A complete description of the region, the sampling strategy as it was adapted to each stratum, and further details on the monitoring program and results over a 1 year period is currently in preparation.
We consider a population of N = 350 fishers labeled from 1 to N and distributed in 12 communities of varying sizes, from 10 to 50. For a given fisher i ∈ (1, …, N) and week j ∈ (1, 2, 3, 4) within a month, data consist in the weekly total fishing effort fij (e.g., number of fishing operations) and the catch of four fish species ci,j = (ci,j, 1, …, ci,j, 4) in kilograms. For simplicity and without lack of generality, we assume that these four species are exaustive in describing the catch.
The finite population is therefore a dataframe with 350 rows and 22 columns: two columns to label fishers and communities followed by five weekly data columns (fi,j, ci,j) for weeks j ∈ (1, 2, 3, 4).
The FPP of interest are the total monthly effort, and this quantity can be estimated by
and the total monthly catch per species s = 1, 2, 3, 4. That is, given a species s, and adding over all weeks and fisher, the total per species Sps is
Twelve groups of fishers (representing communities) of sizes 10, 40, 10, 20, 50, 30, 20, 30, 30, 10, 50, and 50 were fixed to complete a total population of
N = 350. Effort
f, here defined as the number of fishing trips within a week, was generated for each fisher from Poisson distributions with averages 4, 0.5, 1.5, and 2.5 for each of the 4 weeks. The overall averages of catch-per-unit effort were fixed within groups for species “Sp1” to “Sp4”, as sampled values in the ranges [35, 45], [3, 7], [85, 115], and [12, 18], respectively. The total weekly catch for each individual fisher was simulated by sampling
f times from a
Gamma(α/2, 1/2) and adding these
f numbers; where α represents the catch-per-unit-effort per species and group. Finally, to emulate realistic conditions, we added two other features into the catch simulations: (
a) probability of occurrence that vary between species (causing lots of zeros in the data, a very common and annoying feature in practice) and (
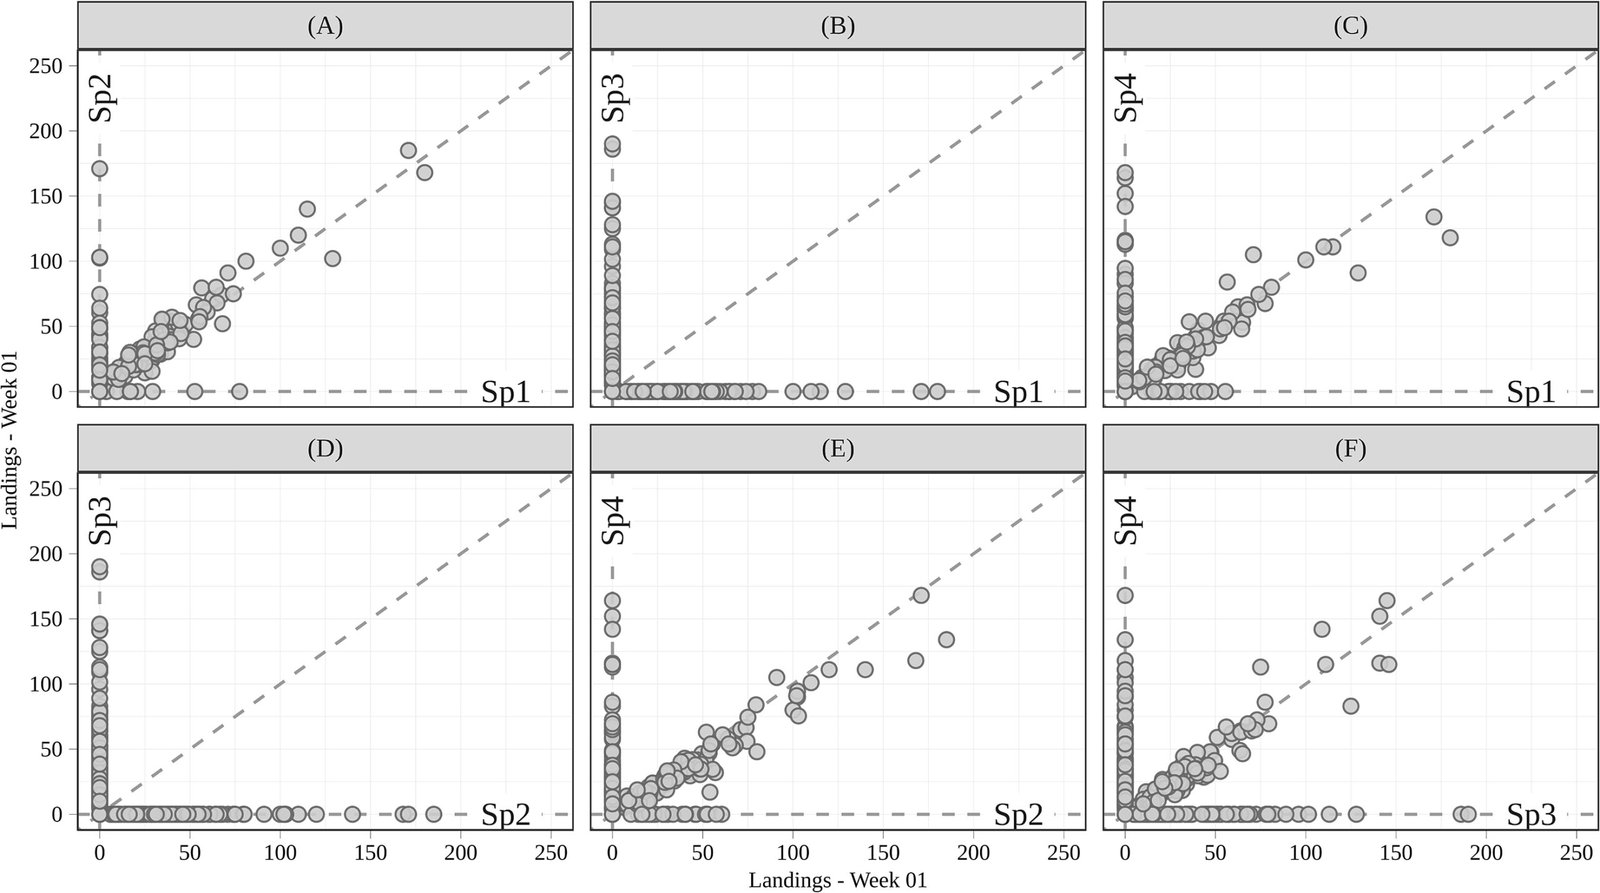
b) correlations between species (induced by manipulating conditional probabilities of occurrence of some species given others). To achieve both goals, we multiplied each term of the matrix of the just simulated catches, by species occurrence-indicators as defined next. We define
x1,
x2,
x3, and
x4 as random quantities simulated from Bernoulli
Ber(
p) distributions:
x1 ∼
Ber(
p1 = 0, 30),
x2|
x1 = 1 ∼
Bern(
p21 = 0.90), and
x2|
x1 = 0 ∼
Bern(
p20 = 0.15). In sequence, we defined
x3 = (1 −
x1)(1 −
x2) to indicate that “Sp3” occurs whenever neither “Sp1” nor “Sp2” occur. Finally,
x4|
x3 = 1 ∼
Bern(
p41 = 0.50) and
x4|
x3 = 0 ∼
Bern(
p40 = 0.80). Some graphical displays and statistical summaries that characterize this synthetic population are given in
Section 3.1 below.
With the synthetic population at hand, we devised a sampling plan from which FPP could be estimated using a Polya posterior distribution. This sampling plan required a realistic field-work dynamic for which exchangeability and ignorability are valid. The next section describes a slightly simplified version of the sampling plan that is being used in the ELP field work.
2.4. The sampling plan
The real world logistics required the coverage of large distances among communities, accessibility challenges dependent on weather conditions, and the number of field personnel to do the work.
Since data were collected through interviews, we considered that the report aggregated effort and landings with respect to the week prior to the week of the interview would result in acceptable accuracy due to the short time lag. Furthermore, since weather conditions can change strongly within days, affecting uniformly all fishers in the population, this stratification by week, was expected to improve the required conditions for exchangeability.
Based on all these considerations, in addition to a previous pilot field study described in
Kinas and Wieczynski (2020), a probabilitic two-stage sampling was proposed. The first stage in selecting randomly
k communities per week with probability proportional to the number possible of permutations of
m fishers within the community, and the second stage by sampling
m fishers from each selected community. With this procedure the same inclusion probability is achieved for all fishers, irrespective of the community size. Hence, each week a total of
k ×
m fishers were asked to report effort and landings for the previous week.
After 4 weeks, a total sample of size n = 4km fishers composes the data available for inference. Since each sampled fisher reported only 1/4 of her (his) monthly landing, the sampling fraction is in fact n/(4N).
To avoid resampling the same community within a month and to give all fishers the same selection probability, irrespective of their community size, we sample at once all 4k communities without replacement and with probability proportional to the number of combinations of m fishers that could be formed within that community. Finally, to avoid that the larger communities, which are expected to be selected first, tend to fall into weeks one or two, we randomized the order of the eight selected communities before splitting them into four weekly groups of size k. From each selected community, m fishers were selected at random without replacement.
To evaluate the robustness of the Polya posterior estimates when equal sampling inclusion probabilities is invalid, we tested two alternative sampling plans, denoted “A1” and “A2”, with increasing deviation from this core assumption. Sampling plan “A1” selected communities (first stage) with equal probabilities, irrespective of its size but retained random sampling of fishers within communities. As a result, sampling plan “A1” gives higher inclusion probabilities to fishers from smaller communities. Sampling plan “A2” added to “A1” higher inclusion probabilities to fishers with better performance within communities. These inclusion probabilities were defined with a logistic model logit(pi) = β0 + β1xi, where xi is the standardized monthly landing for fisher i and pi is predefined inclusion probability; we used β0 = −2.51 and β1 = 0.19.
2.5. Bayesian calibration
The term “calibrated Bayes” was coined by
Little (2006) to describe a strategy to combine the Bayesian strength for inference under a given statistical model, with the tools to assess its frequentistic performance. Little’s idea was to combine both paradigms in order to explore the strength of each.
Given our goal of providing sample-based monthly official statistics of aggregated fish catch and total effort, it was important to evaluate the performance of the Bayesian Polya posterior distributions. There are general quality standards, recommended by FAO for design-based statistical sampling monitoring data (
Stamatopoulos 2002), which we adapted as tools into a Bayesian calibration mindset.
Using the synthetic population to provide the true FPP, and 300 replications of the sampling plan laid out in
Section 2.4, the performance inference could be measured. Hence, our metrics for assessment were defined as follows:
From each replicated posterior Polya distribution j = 1, …, K (where K = 300) and some FPP of interest T, we defined as potential estimates the posterior mean (tj), the posterior median (gj), the 95% percentile credibility interval (CrIj), and the 95% highest posterior density interval (HPDj). The performance of the posterior mean and median as point estimates of T were evaluated by its Absolute Relative Accuracy (ARA), defined as
for the posterior mean with
̅𝑡 denoting the mean of all
M replicated posterior means. Similarly ARA(
g) and
̅𝑔 refer to the posterior medians. These numbers are expressed as percentages, with maximum accuracy at 100%, while dropping as the estimates worsen.
Stamatopoulos (2002) recommends accuracies in the range [90%, 95%] as acceptable for basic fishery statistics.
We further wanted to relate the nominal posterior probability interval to its de facto coverage and precision.
Precision being here quantified as the average width of the intervals, while
coverage as the relative frequency of all intervals containing
T. Ideally, the observed relative frequency should be as close as possible to the nominal value.
Stamatopoulos (2002) defines sample precision in terms of the coefficient of variation CV of an estimate, recommending CV < 15% for basic fishery statistics.